v2.2 [Mar 12, 2013]
For institutional clients, informational symbol suffixes “(B)” and “(S)” are prevented from becoming part of a data request.
When price data is available, typing a valid symbol into the Trade Symbol field should initialize the edit control with a valid price. Previously the field might initially show 0.
A change was made to how illiquid option positions contribute to PNL.
A change was made to cause tick and second charts to update consistently in a 3-hour window following midnight UTC.
v2.0 [Jul 30, 2011]
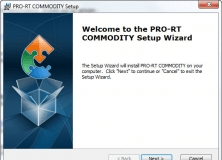
Improvement: Upon startup of the Desktop platform it will automatically check for any available release updates and it will prompt you to update to the newest version, if available. In some cases you may be forced to upgrade but in most cases you will have the option to install the upgrade or to skip it. You also can also use the menu item Help > Check for Newer Version, which will check for any available version. This will be used in the case that there may be a silent version (one which does not prompt you) available.
The General Preferences has a checkbox to always download updates.
Bug Fixed: Platform no longer crashes upon loading certain workspace files.
Bug Fixed: Workspaces now remember last account viewed.
Bug Fixed: New windows now open to the same account as the other windows.
Bug Fixed: New windows are now “on top” by default. To change this setting for an individual window, click in the upper left corner of the window on its icon and un-check “Always on Top”. You can also change this default setting by clicking Tools, then un-checking “New Windows On Top”.
Charts
Improvement: Added CCI study to replace the plugin.
Improvement: Holding down the shift key dragging the divider of a study pane will automatically make all study panes the same size.
Improvement: Added new snapshot field: TradeIncrement, which communicates the minimum traded price increment.
Improvement: Added ability to drag the Open Order lines to change the price of the open order.
Improvement: Added new way to control Auto Cycle speed for Symbol/Interval Bar.
To use this feature, right click on the chart and select “Symbol/Interval Bar”.
This will add the Symbol/Interval bar to the bottom of the chart.
Add the current Symbol and Interval by clicking the and buttons. To add more Symbols and Intervals, change the Symbol/Interval of the chart and press the buttons again. Here is what is will look like once you have added a few Symbols and Intervals:
Now you can easily switch the Symbol/Interval of the chart by clicking on these tabs.
To use the Auto Cycle feature, right click on the Symbol/Interval bar and select properties. Select from the available Auto Cycle options (By Symbol, By Symbol By Interval, By Interval, By Interval By Symbol). Next, use the slide bar to adjust the rate at which it will automatically cycle through the Symbols/Intervals. Click OK.
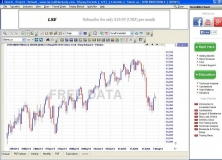
Improvement: Tick charts no longer have a limit to the number of ticks shown. Below is an example of a 512 tick chart with backfill data.
Improvement: Candlestick/Bar width now goes down to 1 pixel.
Improvement: Added Heikin-Ashi chart type.
Heikin-Ashi is a type of candlestick chart that uses a modified formula instead of the traditional open/high/low/close. The formula used for Heikin-Ashi is the following:
Close = (Open+High+Low+Close)/4
Open = [Open (previous bar) + Close (previous bar)]/2
High = Max (High,Open,Close)
Low = Min (Low,Open, Close)
The purpose of the Heikin-Ashi chart is to identify the price trend. Candles with no lower shadows occur during a strong uptrend. Candles with no upper shadow occur during a strong downtrend.
Improvement: Added middle line indicator to all hi-low band studies, which can be displayed and its settings controlled in the studies settings panel as shown in the following CCI settings window:
Improvement: Added Symbol/Interval Expression Bar to Chart, which can be toggled on/off in the following right click context menu (on by default):
Improvement: Added “Change” and “ChangePct” fields to snapshot window.
Improvement: Added new moving average studies.
Improvement: Added ability to display price for horizontal lines on either the right or left side. Below is an example of the price displayed on the left side:
To display the price on the right side, right click on the horizontal line and select Preferences. The bottom of the Preferences window has the option to display the text on the Left or Right.
Improvement: Open Order and Position line – added ability to show or not show the text and to display the text on the left or right side. Below is an example of the Position line text displayed on the left side:
To change these settings, right click on the Open Order or Position line and select Preferences. There is a check box to Show Text Line and there are radio buttons to display on the left or right. Here is an example of the Text turned off:

ScandAll PRO is software for scanning images in conformity with the standards.
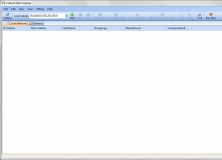
Scan and detect IP and MAC addresses from the machines on your local network.